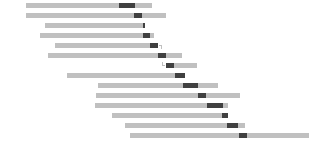
Tracking 19,000 runners over 1,000km across virtual Tennessee
How do you show large numbers of people without losing track of the outliers? How do you keep a chart useful when the maximum values are orders of magnitude higher than the common ones? In an animated visualization I've built of the progress of over 19,000 runners across a virtual 1000km (635mi) race over 123 days, I've tried to solve some of these issues.