
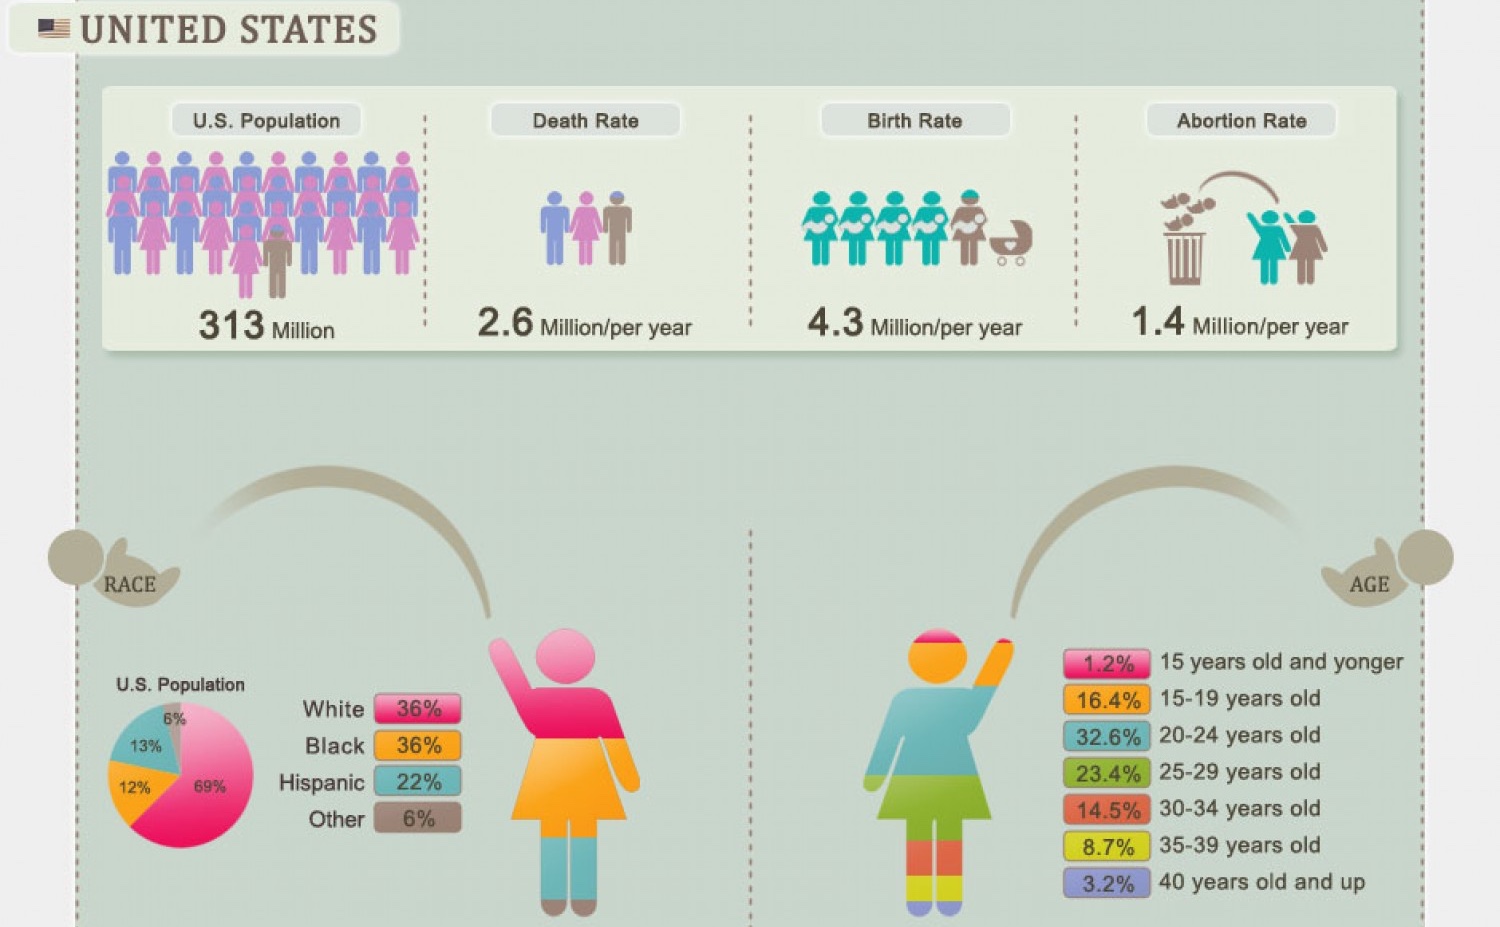
In his piece Disinformation Visualization: How to lie with datavis (archived), Mushon Zer-Aviv makes some interesting points about how framing the same data differently in visualization can make a big difference. Using the example of the abortion debate, he shows the usual chart tricks, cherry-picking, subsetting, etc., that is done to make the data support a particular story.
This is a slightly more opinionated view of some of the work I've mentioned recently, like Enrico Bertini's paper on deceptive visualization and our work on bar chart embellishments.
▶
Comments (1)
Posting new comments was disabled in 2020.